
Irradiation maps anywhere between 62° S and 62° N.
Meteonorm maps are based on the Meteonorm database and the Meteonorm interpolation algorithms. As each map point is calculated separately, the production of a Meteonorm map requires a lot of computing power.
Direct normal (beam) radiation as well as global radiation maps are the most requested ones. However, we can produce maps for virtually any meteorological parameter.
Available resolutions
- standard resolution: 8 km
- high resolution: 3 km (nur Europe)
- very high resolution: 0.1–1 km
Additional information
- standard format: PNG
- very high resolution: max. 50'000 data points (horizon taken into consideration)
Demo Files

Europe – Yearly sum of global horizontal irradiation (1991–2010), grid cell: 0.02°
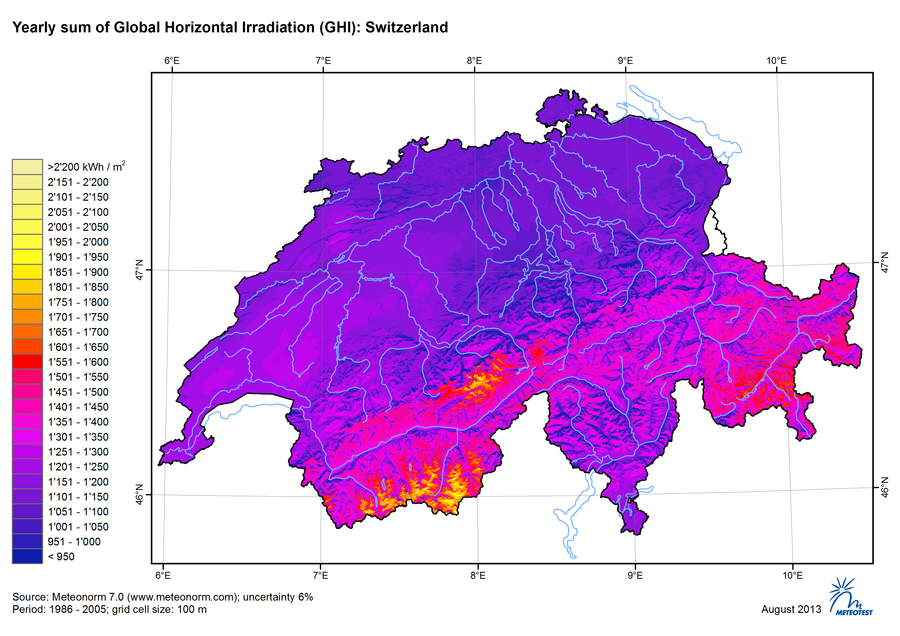
Switzerland – Yearly sum of global horizontal irradiation (1991–2010), grid cell: 100 m

World – Yearly sum of global horizontal irradiation (1991–2010), grid cell: 0.125°
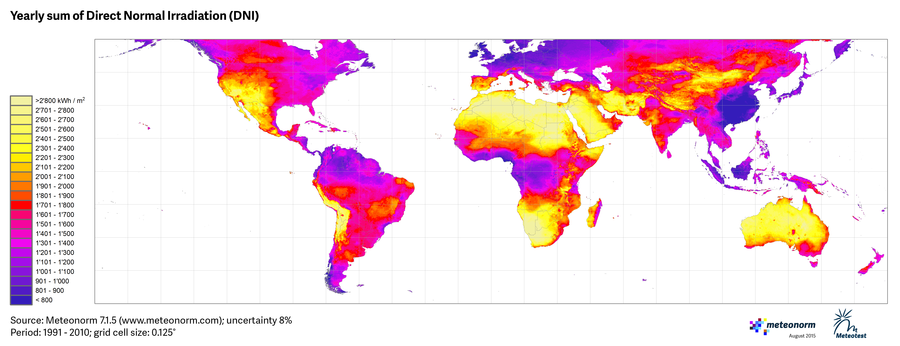
World - Yearly sum of Direct Normal Irradiation (DNI) (1991 - 2010), grid cell: 0.125°
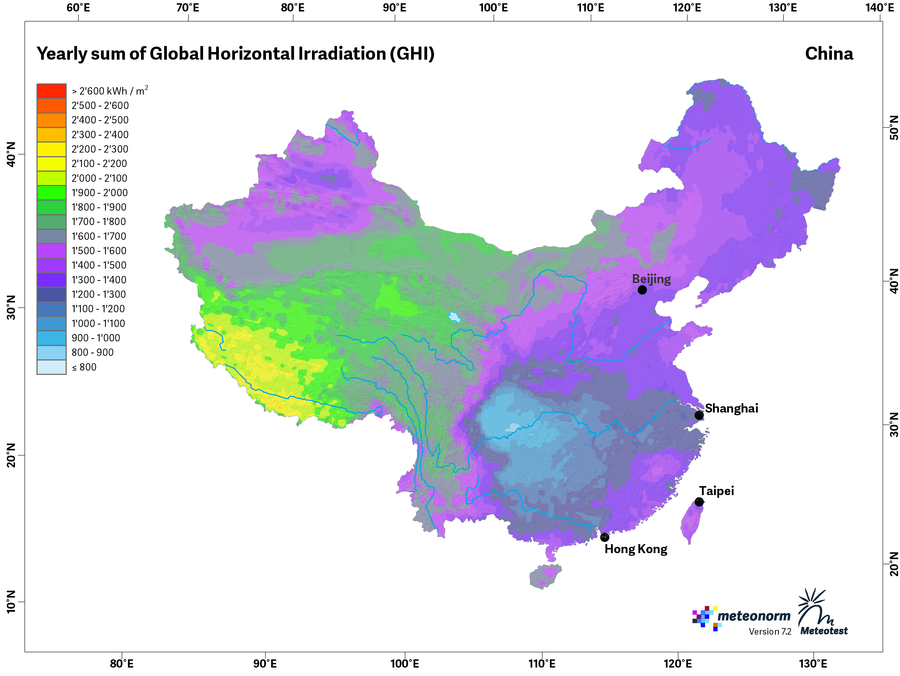
China – Yearly sum of global horizontal irradiation (1991–2010)
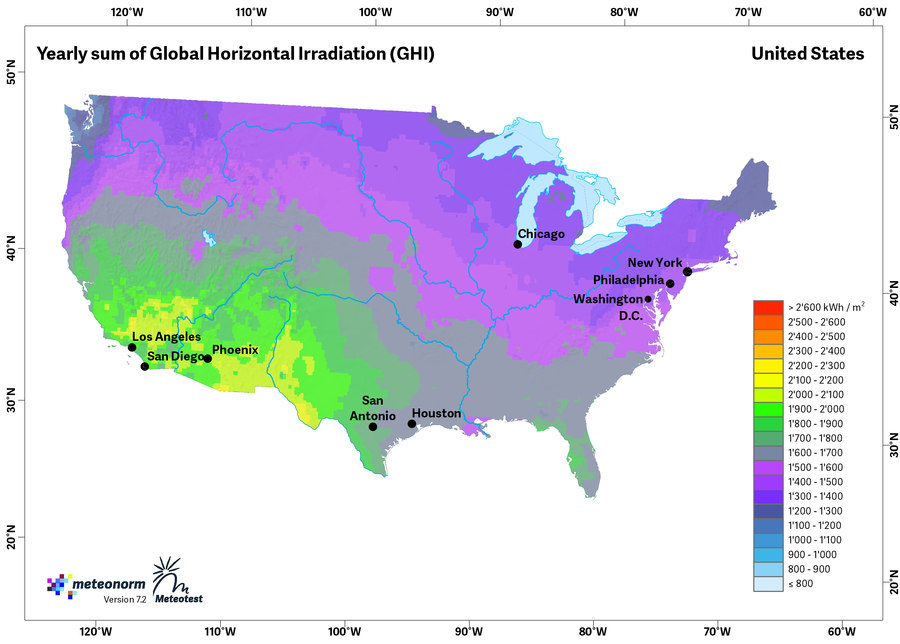
USA – Yearly sum of global horizontal irradiation (1991–2010)
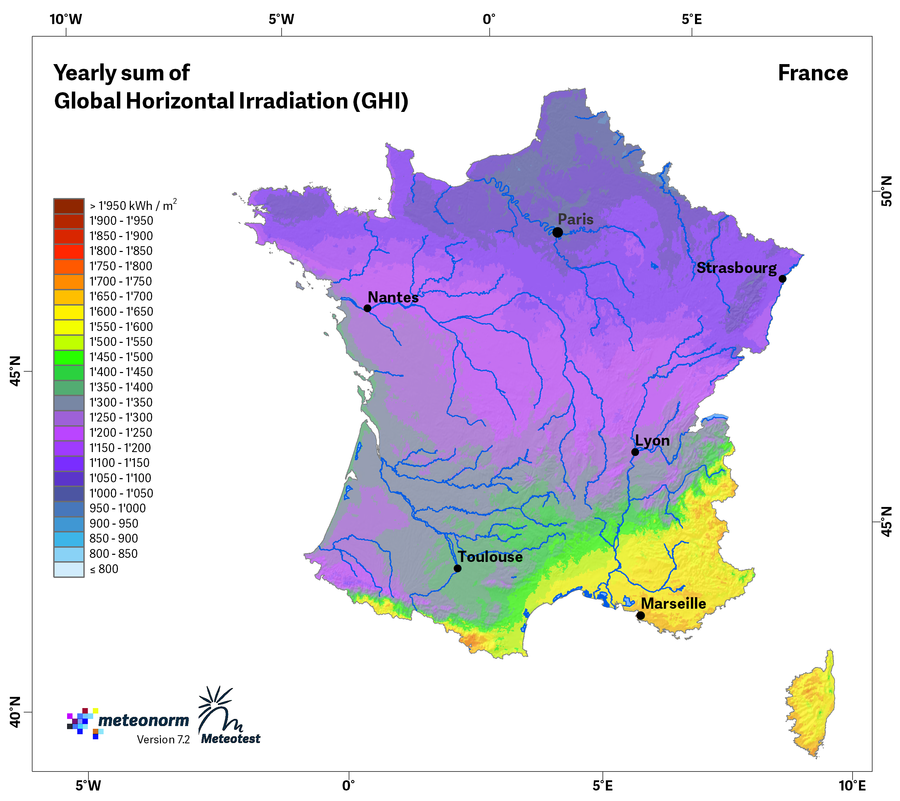
France – Yearly sum of global horizontal irradiation (1991–2010)